
Liquidity sweep: what it is and how to spot one
By Bec, futures trader and founder of Wildflower · Updated
A liquidity sweep is when price trades past an earlier high or low, then closes back inside. The wick pokes through the level, but the candle doesn’t stay there. It’s also called a stop hunt, a raid or a liquidity grab.
Why it’s called a liquidity sweep
In everyday markets, How easily you can buy or sell without moving the price. On charts, traders also use it for orders they think are waiting above highs and below lows.More in the glossary means how easily you can buy or sell. On charts, traders use the word for orders they think are waiting just past a high or a low.
Here’s the thinking. Someone who sold near a high often puts a An order that closes a trade if price reaches a level you set against it. It aims to limit the loss, but in a fast market it can fill at a worse price.More in the glossary just above it. A stop loss on a sell trade is a buy order. Traders waiting to buy a move past the high may also leave buy orders there. So above a high, there may be a pile of buy orders. ICT traders call that buy-side liquidity. Below a low, the same happens with sell orders: sell-side liquidity.
When price runs through that spot and fills those orders, then turns back, traders say the liquidity was swept. You can’t see those orders on a normal chart. The name describes the idea, and the shape is what you mark.
How to identify a liquidity sweep, step by step
1. Mark an earlier high
Find a A peak on the chart: a candle whose high is above the highs of the candles on both sides of it.More in the glossary, a peak with lower highs on both sides. Draw a line at the tip of its wick.
2. Watch price trade above it
Later, a candle’s wick goes past the line. Price has traded above the old high.
3. Check the close
Where did that candle close? If it closed back below the line, the move above didn’t hold.
4. That’s the sweep
A trade past the high, then a close back below it. The bit of wick above the line is the part that was swept.
For a low, flip it: the wick goes below an earlier low, and the candle closes back above it.
Sweeps of highs and sweeps of lows
Sweep of a high. Price trades above an earlier high, then closes back below it. The idea is that it fills the buy orders waiting above the high, so it’s also called a buy-side sweep. Some traders see it as a sign the move up has run out. It doesn’t have to be.
Sweep of a low. Price trades below an earlier low, then closes back above it. This is a sell-side sweep.
What counts, and what doesn’t
It has to go past. Price must trade beyond the level, not just reach it. Some traders want it to go past by a set number of The smallest step a price can move. On many stock index futures that’s 0.25 of a point.More in the glossary.
It has to come back. If the candle closes past the level and stays there, that’s a When price moves past a level, such as the top or bottom of a range, and keeps trading beyond it.More in the glossary, not a sweep.
It can take more than one candle. One candle may go past the high, and the next closes back below. Many traders allow a few candles for the close back inside. The number is your call.
Too far isn’t a sweep. If price runs a long way past the level before it comes back, some traders stop calling it a sweep. Where that line sits is your choice.
The level matters. Some traders only count well-known highs and lows. See the next section.
Which highs and lows get swept
A sweep can happen at any level traders watch. The ones you’ll hear about most:
Swing highs and swing lows. The peaks and dips on your chart.
Equal highs and equal lows. Two or more highs, or lows, at almost the same price. Many traders see these as extra obvious places for stops. Read about equal highs and lows.
Yesterday’s high and low. The highest and lowest prices of the day before. Read about the previous day high and low.
A session’s high and low. Such as the high and low made overnight, before the main session opens.
The opening range. The high and low of the first minutes after the open. Read about opening range breakouts.
What can happen after a sweep
A sweep only describes what price just did. Here’s what can follow:
Price turns away. It moves off in the other direction from the level it swept.
Then a break of the last low. After sweeping a high, a candle closes below the last swing low. Many traders call that a The first break against the trend. In an uptrend, a candle closing below the latest higher low.More in the glossary, and some wait for it before they treat the sweep as meaningful. Read about change of character.
Price breaks through anyway. It comes back later and closes above the high after all. A sweep doesn’t stop that.
A sweep can’t tell you which will happen.
Stop hunt, raid, grab: where the names come from
Traders have talked about “running the stops” for a long time. Liquidity sweep, raid and buy-side or sell-side liquidity are Inner Circle Trader, a trading educator whose names for chart patterns, like fair value gap, are now widely used.More in the glossary terms, now used widely in smart money concepts. Stop hunt and liquidity grab mean the same thing. Turtle soup is an older name for trading a false break of a recent high or low, from a 1995 book by Laurence Connors and Linda Raschke.
Often confused with
Breakout. Price moves past a level and keeps going. The difference is the close: a breakout stays past the level, a sweep comes back.
False breakout. Nearly the same shape. People often use the words for the same thing. “False breakout” describes a break that failed. “Sweep” describes the orders the move is thought to have filled.
Swing failure pattern. Another name for price trading past a swing high or low and closing back inside. Read about the swing failure pattern.
Change of character. A close through a swing point against the trend. A sweep goes past a level and comes back. A change of character closes through one. Read about change of character.
Liquidity sweep indicator for TradingView
Have every sweep marked for you, to your own rules
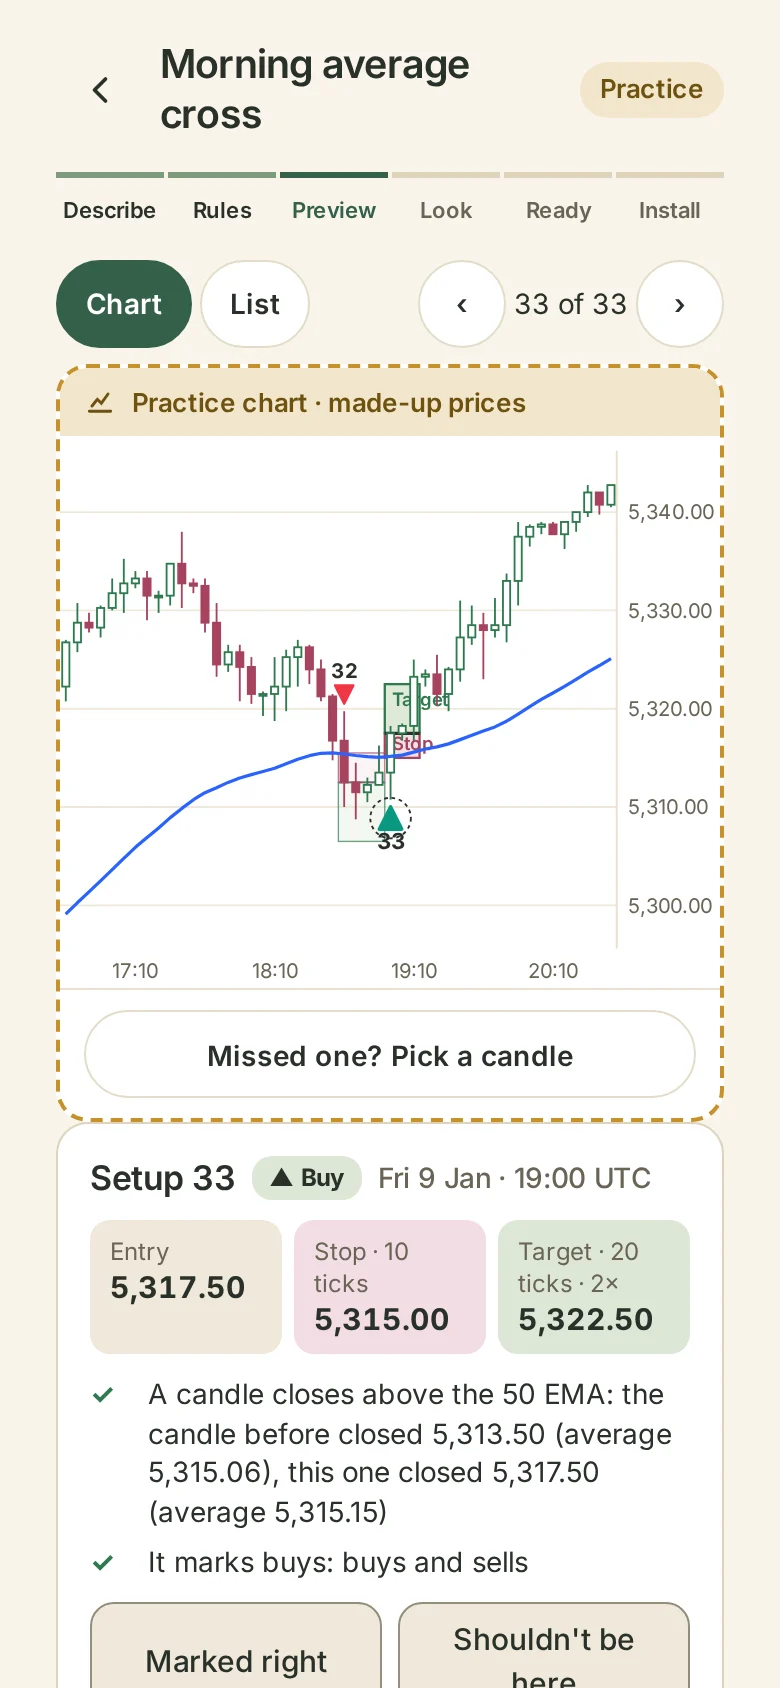
Keeping track of every earlier high and low, and checking each close against them, is a lot to do by eye. Instead, tell Wildflower’s Indicator what you want in plain words, like “mark every candle that trades above a recent swing high and closes back below it”. No coding needed. It marks every sweep on a chart so you can check it matches your rules. Then it gives you a script to add to TradingView, with a step-by-step guide.
Try it free. You only pay when you add it to TradingView.
Common questions
What is a liquidity sweep in trading?
Price trades past an earlier high or low, then closes back inside. The wick goes through the level, but the candle doesn’t stay.
Is a liquidity sweep the same as a stop hunt?
Yes. Stop hunt, raid, liquidity grab and liquidity sweep all describe the same shape.
What is buy-side liquidity?
The buy orders traders think are waiting above a high, such as stop losses on sell trades.
What is sell-side liquidity?
The sell orders traders think are waiting below a low, such as stop losses on buy trades.
What’s the difference between a sweep and a breakout?
The close. A breakout closes past the level and stays. A sweep closes back inside.
Does the sweep have to close back on the same candle?
Not always. Some traders allow a few candles for the close back inside. The number is your choice.
Does a sweep mean price will reverse?
No. It describes what price did. Price can turn, drift, or come back and break through.
Which timeframe is best for liquidity sweeps?
There’s no best one. Sweeps show up on every timeframe. The one you watch is your choice.
Can I get a liquidity sweep indicator for TradingView?
Yes. Describe your rules in plain words and Wildflower builds the indicator. Preview it free on a chart, then pay only when you add it to TradingView. See the Indicator.