Wildflower writes your indicator for TradingView from your rules and checks it first, so it pastes in with no errors.
Choose how it looks
Choose Get it ready for TradingView, then pick how it looks: Arrows, Trade boxes, Arrows and boxes (where it starts) or Lines only. Each is shown on your own chart, with Buy, Sell and Lines colours to set. Your next indicator starts with the look you chose last. To change it later, use Change how it looks on the preview. A new look makes a new script: copy it again and it replaces the old one. A chart that already has it keeps its settings, so remove it from the chart and add it again.
Ready for TradingView
Next you see No errors and, with a chart loaded, how many setups it draws against your preview. Your settings in TradingView lists what you can change in TradingView's settings. See the code opens once you subscribe.
If it needs one more answer first, it is asked here. If part of your indicator can't go on TradingView yet, that part is named, and you can keep using the preview in the meantime.
Copy it
Choose Add it to TradingView. Each step has a small drawing of where to click.
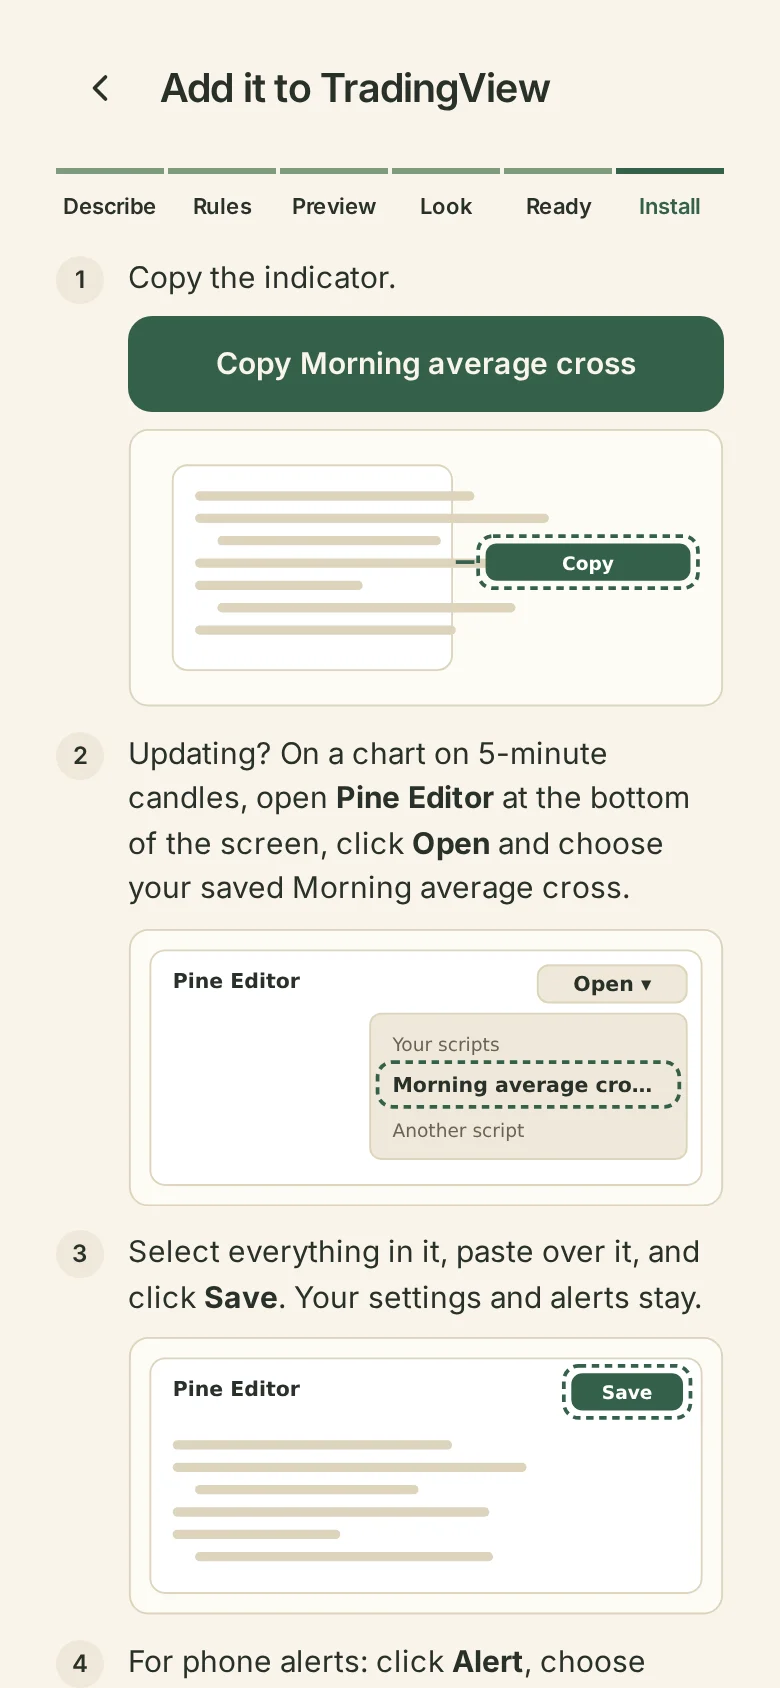
Not subscribed yet? Add to TradingView opens the plans. After you pay, you see Setting up your plan, then You're subscribed with Copy. Subscribed? Press Copy. If your browser won't copy, use See the code. On a phone, choose Email me the steps: TradingView's phone app can't add indicators.
Paste it in
- On a chart using your indicator's candle size, open Pine Editor at the bottom of the screen.
- Select everything in it, paste, and click Add to chart.
- For phone alerts: click Alert, choose your indicator, then Create.
- To change its settings, point at your indicator's name at the top left of the chart and click the gear.
Updating? In Pine Editor, click Open and choose your saved indicator. Select everything, paste over it and click Save. Your settings and alerts stay.
Conditions you added are part of the script, with their numbers under Filters in the settings. A condition on larger candles, such as 15-minute ones on a 5-minute chart, is built from your chart's own candles, so keep the chart on your indicator's candle size.
What it draws
What you chose starts on, and every choice stays in TradingView's settings:
- Triangles under each buy and over each sell (Show triangles), named "Buy setup" and "Sell setup" in Style.
- Entry, stop and target boxes for the five most recent setups (Show position tools). To see more, raise Position tools: recent setups shown.
- Setup numbers, as in your Wildflower list, are off until you turn on Show setup numbers.
- A line from larger candles is named with its candle size, such as EMA (3-minute), and steps once for each larger candle.
- A range's high and low are flat lines, such as Opening range high and Opening range low, shown from the end of the range until the end of that day. Highest high and Lowest low are drawn as steps.
- A setup's boxes end where its stop or target is reached, or just before the market's daily close at 4pm Chicago time, with a small Daily close label, because the Bot closes an open trade there too. It does not use a holiday's early close or your prop firm's earlier close time.
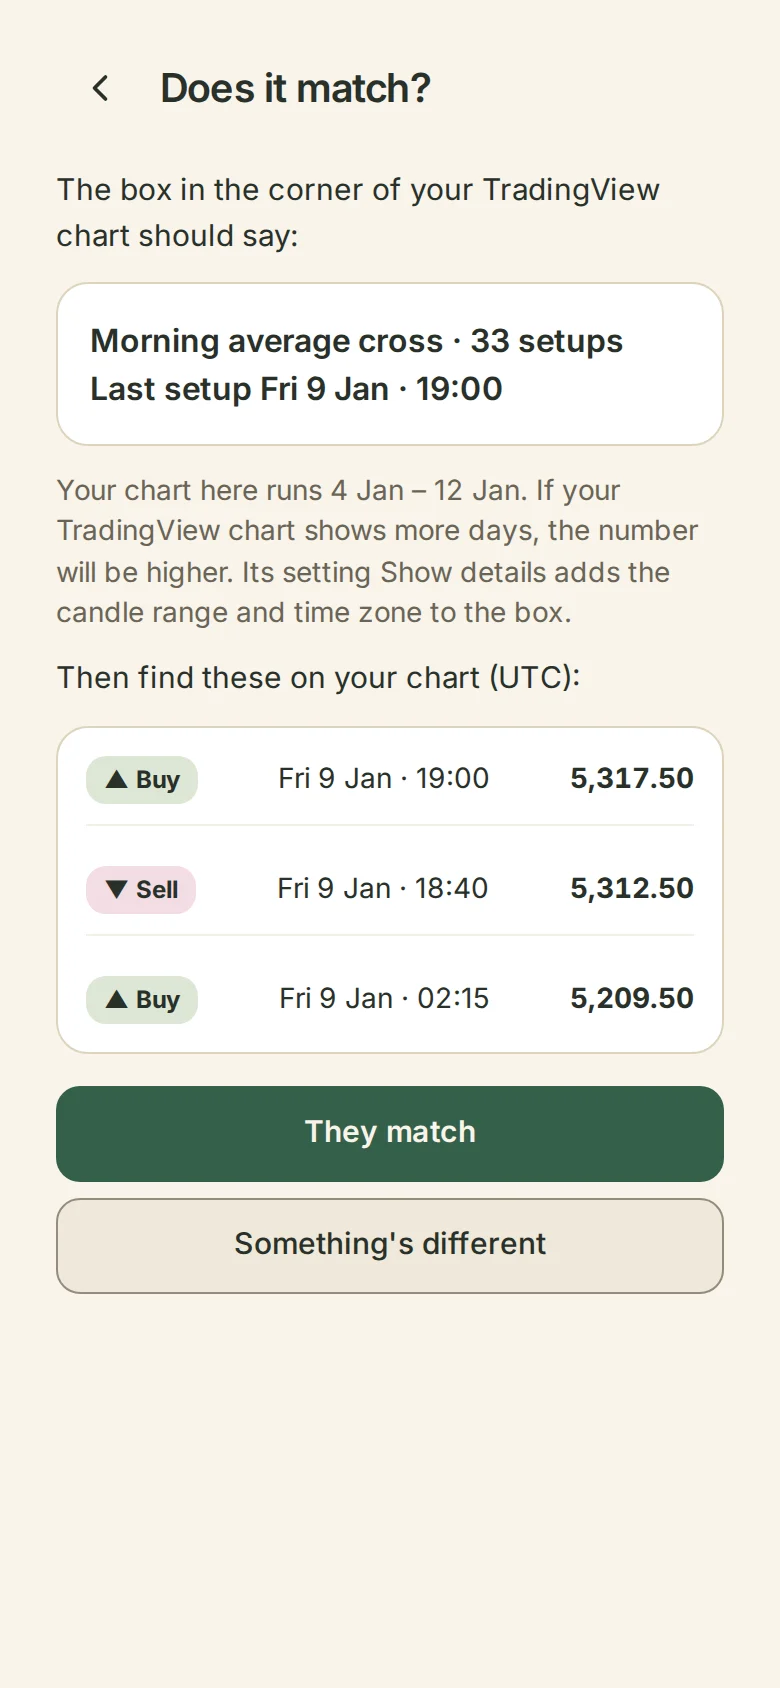
- A small box in the top right corner: what the marks mean, your indicator's name, how many setups it found, the first and last setup, and its chart. Show details adds the candle range, the time zone and your rules.
The look changes only what is drawn, never a setup, its stop or target, or its alerts.
Does it match?
Choose It's on my chart, and compare with the box on your TradingView chart. Wildflower lists three setups to find on your chart, with their times and entries. If your chart shows more days than your file, the number is higher.