
Fair value gap (FVG): what it is and how to spot one
By Bec, futures trader and founder of Wildflower · Updated
A fair value gap is a price range that a fast move skips over. Look at three One bar on a price chart. It shows where price opened and closed, and the highest and lowest it reached, in one stretch of time.More in the glossary in a row. If the The thin lines above and below a candle’s body. Their tips are the highest and lowest prices in that candle.More in the glossary of the first and third candles don’t overlap, the space between them is the gap.
Why it’s called a fair value gap
Traders call a price where lots of buying and selling happened “fair value”, because both sides agreed on it. In a fast move, price rushes through a range mostly in one direction, and very little trading happens there. That range never got its fair share of trading, so traders call it a fair value gap, or FVG. You’ll also hear it called an imbalance.
How to identify a fair value gap, step by step
1. Pick three candles in a row
Any three, on the How much time each candle covers, such as 1 minute or 1 hour.More in the glossary you’re looking at.
2. Mark two prices
For a move up, the first candle’s high and the third candle’s low. Use the tips of the wicks.
3. Check for a space
If the third candle’s low is above the first candle’s high, there’s a space between them.
4. Shade it
That band is the fair value gap. Then move along one candle and check the next three.
For a move down, flip it: check if the third candle’s high is below the first candle’s low. The middle candle is usually the big move that made the gap (traders call that A strong, fast move in one direction, often one big candle.More in the glossary). You don’t measure it. Only candles one and three decide if there’s a gap.
Bullish and bearish fair value gaps
Bullish FVG. After a move up, the third candle’s low is above the first candle’s high. The gap runs between those two prices. Inner Circle Trader, a trading educator whose names for chart patterns, like fair value gap, are now widely used.More in the glossary traders also call it a BISI (buy side imbalance, sell side inefficiency).
Bearish FVG. After a move down, the third candle’s high is below the first candle’s low. The gap’s bottom is the third candle’s high and its top is the first candle’s low. ICT traders also call it a SIBI (sell side imbalance, buy side inefficiency).
What counts, and what doesn’t
Touching isn’t a gap. If the two prices are the same, there’s no space, so there’s no gap.
Wicks count, not bodies. Two bodies can leave a space while their wicks still overlap. That’s not a fair value gap.
Colour doesn’t decide it. The first and third candles can be green or red. Only their highs and lows matter.
Size is your call. A gap can be one The smallest step a price can move. On many stock index futures that’s 0.25 of a point.More in the glossary wide. Many traders ignore gaps smaller than a size they choose. There’s no single rule.
Timeframe matters. One 15-minute candle covers the same time as fifteen 1-minute candles, so its high and low are different. A gap on one chart may not show on the other.
Gaps across a pause. Futures take a short break each day, and most markets close for the weekend. The next candle can open far away. Some traders count a gap across a pause, others leave it out.
The size and the timeframe can be set in your own indicator. It reads the wicks, ignores colour and doesn’t count touching prices as a gap. Leaving out gaps across a pause isn’t one of its settings. More on that below.
What can happen after a gap forms
Many traders keep a gap marked until price comes back to it. A few things can happen:
Partly filled. Price comes back into part of the gap. The halfway point has its own name: The halfway point of a fair value gap.More in the glossary, or CE. Many traders mark it and note whether price reached it.
Filled. Price trades through the whole gap. ICT traders often say the gap is mitigated.
Closed through. A candle closes past the far edge of the gap. See the next section.
Some gaps are never reached again. A gap can’t tell you which will happen.
Inverse fair value gap (IFVG)
An A fair value gap that a candle has closed through, then watched from the other side.More in the glossary is a gap that a candle has closed through. For a bullish gap, that means a candle closes below its bottom. For a bearish gap, a candle closes above its top. Traders who use them then watch the same band from the other side. A wick poking through doesn’t count. The candle has to close there.
ICT fair value gaps: where the term comes from
The term was made popular by ICT (Inner Circle Trader), a trading educator whose videos many traders learn from. It’s now used widely, well beyond ICT. The pattern is drawn the same way on any candle chart: futures, forex, crypto or stocks.
Often confused with
Volume imbalance. A space between the bodies of two candles next to each other, while their wicks still overlap.
Opening gap. The jump between one close and the next open, made by a pause in trading, not by three candles. ICT traders call the daily one a new day opening gap (NDOG) and the weekly one a new week opening gap (NWOG).
Liquidity void. A long, one-way run across several candles that leaves a wide stretch of price barely traded. It often holds several fair value gaps.
Balanced price range (BPR). Where a bullish gap and a bearish gap overlap. The overlap is the balanced price range.
Order block. The last candle before a strong move. It’s often drawn next to a fair value gap, but it’s a different idea. Read about order blocks.
Fair value gap indicator for TradingView
Have every gap marked for you, to your own rules
Checking every set of three candles by hand is slow, and it’s easy to miss one. Instead, tell Wildflower’s Indicator what you want in plain words, like “mark every bullish fair value gap, and ignore any smaller than the size I set”. No coding needed. It marks every gap on a chart so you can check it matches your rules. Then it gives you a script to add to TradingView, with a step-by-step guide.
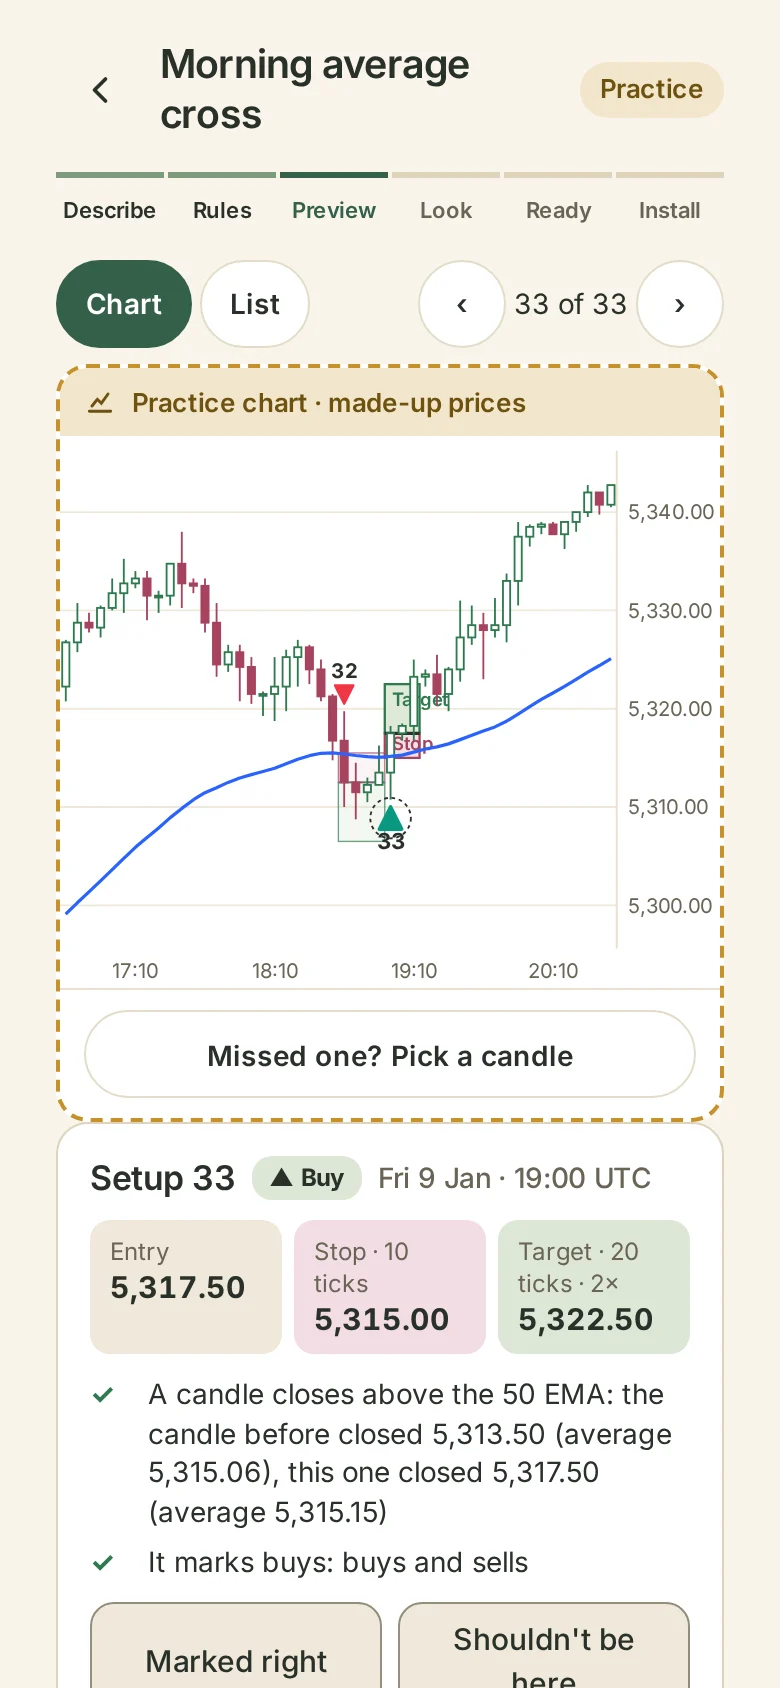
Try it free. You only pay when you add it to TradingView.
Common questions
What does FVG stand for?
Fair value gap.
Is a fair value gap the same as an imbalance?
Often, yes. Many traders use the words the same way. ICT traders keep “volume imbalance” for a space between two candle bodies.
What is an inverse fair value gap?
A fair value gap that a candle has closed through, now watched from the other side. More above.
What is consequent encroachment?
The halfway point of a fair value gap.
What’s the difference between a fair value gap and an order block?
A fair value gap is the space three candles leave. An order block is the last candle before a strong move. They often sit next to each other.
Which timeframe is best for fair value gaps?
There’s no best one. A gap can form on any timeframe. The one you watch is your choice.
Do all fair value gaps get filled?
No. Some are filled quickly, some partly, and some never.
How big does a gap have to be?
Any space counts. Many traders set a minimum size in ticks so tiny gaps don’t clutter the chart.
Do fair value gaps work in forex, crypto and futures?
They form on any candle chart, in any market, because they only need three candles.
Can I get a fair value gap indicator for TradingView?
Yes. Describe your rules in plain words and Wildflower builds the indicator. Preview it free on a chart, then pay only when you add it to TradingView. See the Indicator.