
Displacement in trading: what it is and how to spot it
By Bec, futures trader and founder of Wildflower · Updated
Displacement is a strong, fast move in one direction, made of one or a few big candles with large bodies and small wicks. It’s a term from ICT-style trading. There’s no official rule for how big the move must be, so each trader sets their own.
What displacement means, and why it’s called that
Most of the time, One bar on a price chart. It shows where price opened and closed, and the highest and lowest it reached, in one stretch of time.More in the glossary overlap. Price goes up a bit, down a bit, and each candle trades over much of the last one. Then, now and then, price moves hard in one direction. The candles get bigger, their bodies fill most of their height, and each one opens near where the last one closed.
Traders call that kind of move A strong, fast move in one direction, often one big candle.More in the glossary: price is displaced, pushed away from where it was. You’ll also hear it called an impulse, an expansion or a thrust.
It’s a description, not an official market event. No exchange measures it. One trader’s displacement is another trader’s ordinary move, which is why the rule you use matters.
How to identify displacement, step by step
1. See what normal looks like
Look at the candles before. Here, four quiet candles cover just 2.25 points.
2. Find the fast move
Look for candles that are much bigger, all going the same way.
3. Measure it
From the lowest low to the highest high of the move: 101 to 113, 12 points in three candles.
4. Look at what it left
A fast move often leaves fair value gaps: prices it skipped over.
There are other checks traders add. Did the bodies fill most of the move? Did the move break a recent high or low? How big was it compared with the candles just before? Each trader picks their own.
Bullish and bearish displacement
Bullish displacement. A fast move up. The candles are mostly green, close near their highs, and each opens near the last close.
Bearish displacement. A fast move down. The candles are mostly red and close near their lows.
What counts, and what doesn’t
Mostly body. In the first picture, the three bodies add up to 11.5 points of the 12-point move. Long wicks, as in the second picture, mean price was pushed back within each candle. Many traders wouldn’t call that displacement.
Fast, not just far. The third picture covers the same 12 points, but over nine candles that overlap. It’s a steady climb, not a burst.
How big is big enough? There’s no single rule. Some traders set a smallest move in The smallest step a price can move. On many stock index futures that’s 0.25 of a point.More in the glossary, within a number of candles they choose. Others compare it with the candles before.
One candle or several. It can be one very large candle or a short run of them. The number of candles is part of your rule.
News moves. A burst at a news release can look the same. Some traders count it, others leave news times out.
The number of candles, a smallest move, a smallest body and a largest wick can all be set in your own indicator. Comparing a move with the candles before it, and a news calendar, aren’t among its checks. More on that below.
Ways traders measure displacement
Displacement has no official formula, but these are the ways traders most often put a number on it:
- Size in ticks, within a set number of candles. For example, a move of at least a number of ticks you choose, within three candles.
- How much is body. The bodies must fill at least a share of the move you choose, so long wicks don’t count.
- Compared with before. The span of the last few candles against the span of the same number before them. Here, 12 points against 1.75.
- Compared with the A candle’s high minus its low: how far price travelled in that candle, wicks included.More in the glossary lately. Some traders compare the move with the average height of recent candles, or with the ATR (average true range).
Each gives a different answer on the same chart. That’s why two traders can look at the same move and disagree about whether it was displacement.
How traders use displacement
In ICT-style trading, displacement is mostly used as a check on other things:
Fair value gaps. A gap left by displacement is the kind many ICT traders mark. Read about fair value gaps.
Order blocks. An The last candle that moved the other way before a strong move, often marked as a zone traders watch.More in the glossary is the last opposite candle before a strong move. Displacement is that strong move. Read about order blocks.
Breaks of structure. Many traders want a A candle closing past the latest swing high in an uptrend, or past the latest swing low in a downtrend.More in the glossary to happen with displacement, not with a slow drift. Read about breaks of structure.
After displacement, price might keep going, come back into the gaps, or give the whole move back. Displacement describes the move that already happened. It can’t tell you which comes next.
Displacement in ICT: where the term comes from
The word was made popular by Inner Circle Trader, a trading educator whose names for chart patterns, like fair value gap, are now widely used.More in the glossary (Inner Circle Trader), and it’s now used widely in smart money concepts. Older names for the same idea include an impulse move, a wide range bar or a thrust. It looks the same on any candle chart: futures, forex, crypto or stocks.
Often confused with
Breakout. Price moving past a level, such as the top of a range. A breakout can be slow or fast. Displacement is about how the move looks, not which level it passed.
Momentum. How strongly price has been moving lately, often measured with an indicator like the RSI. Displacement is read straight from the candles.
Wide range bar. One candle much taller than recent ones. It can be displacement, but it can also be mostly wick. Read about wide range bars.
Volatility. How much price moves in general. A market can be volatile and choppy, with big candles in both directions and no displacement at all.
Displacement indicator for TradingView
Have every displacement move marked, to your own rules
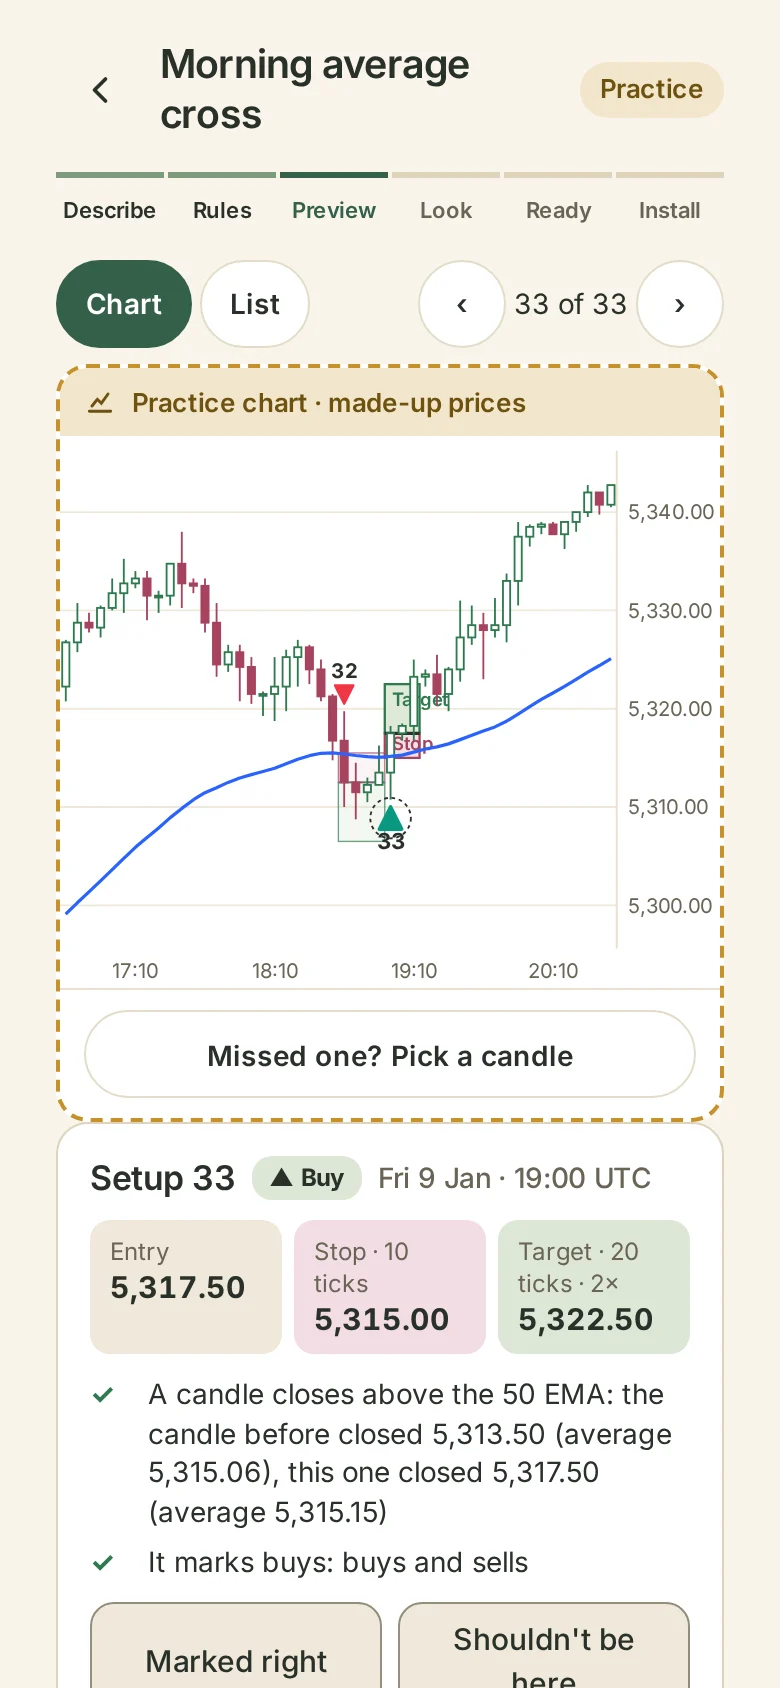
Judging “strong enough” by eye changes from day to day. Instead, tell Wildflower’s Indicator what you mean in plain words, like “mark a move up where the third candle’s low is above the first candle’s high, with a body of at least the ticks I set”. It can check the newest of the candles you choose sits wholly past the oldest one, with a smallest body, a smallest move and a largest wick that you set. It marks every one on a chart so you can check it matches your rules. Then it gives you a script to add to TradingView, with a step-by-step guide.
Try it free. You only pay when you add it to TradingView.
Common questions
What is displacement in trading?
A strong, fast move in one direction, usually one or a few big candles with large bodies and small wicks.
What is displacement in ICT?
The same idea: a sharp, one-way move. ICT traders use it to judge fair value gaps, order blocks and breaks of structure.
How many candles is displacement?
It can be one candle or a short run. The number is part of the rule you choose.
How big does a displacement candle have to be?
There’s no official size. Traders set a size in ticks, or compare it with recent candles.
Does displacement always leave a fair value gap?
Often, but not always. Some traders require a gap as part of their rule, others don’t.
Is displacement the same as a breakout?
No. A breakout is price passing a level. Displacement describes how fast and how cleanly price moved.
Is displacement bullish or bearish?
Either. It’s bullish when the move is up and bearish when it’s down.
Which timeframe is best for displacement?
There’s no best one. It shows up on every timeframe. The one you watch is your choice.
Can I get a displacement indicator for TradingView?
Yes. Describe your rules in plain words and Wildflower builds the indicator. Preview it free on a chart, then pay only when you add it to TradingView. See the Indicator.